
Timeline
Timeline
2025-06-24
init
2025-10-07
add gdb in emacs
2025-10-09
add complementary skills
2025-10-10
add multithread debugging
2025-10-13
add multiprocess debugging,remote debugging,coredump debugging,add memory problem check
This article introduces the usage of the GDB debugging tool, covering basic configuration, startup parameters, breakpoint setting, source code viewing, debugging core dump files, multi-threaded/multi-process debugging, and provides common commands and examples.
gdb configuration
Messy display in TUI mode
Reference:
In short, create~/.config/gdb/gdbinitfile and then write the following content
123456789101112 | define ccontinuerefreshenddefine nnextrefreshendset debuginfod enabled onset print pretty |
For C++ debugging, it is recommended to use the following extended commands to view STL containers more conveniently:
The following commands are available:
12345678910111213 | std::vector<T> -- via pvector commandstd::list<T> -- via plist or plist_member commandstd::map<T,T> -- via pmap or pmap_member commandstd::multimap<T,T> -- via pmap or pmap_member commandstd::set<T> -- via pset commandstd::multiset<T> -- via pset commandstd::deque<T> -- via pdequeue commandstd::stack<T> -- via pstack commandstd::queue<T> -- via pqueue commandstd::priority_queue<T> -- via ppqueue commandstd::bitset<n> -- via pbitset commandstd::string -- via pstring commandstd::widestring -- via pwstring command |
gdb cannot see the program’s printf output
This is because the output is buffered. Use the following command:
1 | call fflush(stdout) |
Use different terminals for I/O input and output
By default, gdb and the program use the same terminal for input and output. You can specify a separate input/output terminal for the program. First open a terminal and run the tty command to get the current terminal name.
Then start:
1 | gdb -tty /dev/pts/3 ./a.out |
Using gdb in emacs
Mainly use gdb’s MI mode, refer to

gdb TUI mode
In TUI mode, up to 3 windows are displayed, and the command window always exists.
Open TUI mode and open source code
1 | (gdb) layout src |
Breakpoints before the line numbers in the source window
- B means it has been hit, at least once.
- b means it has not been hit yet.
- means the breakpoint is enabled.
- means the breakpoint is disabled.
Show assembly window
1 | (gdb) layout asm |
Show register window
1 | (gdb) layout reg |
Split window
1 | (gdb) layout split |
Switch window focus
12 | (gdb) focus src/asm/reg/cmd(gdb) fs asm |
View the currently focused window
1 | (gdb) info win |
Exit window mode
Ctrl + x +a
Launch gdb
Compilation stage: add debug information
For GDB to see function names, variable names, and source line numbers, you must add-gthe parameter during compilation:
12 | gcc -g hello.c -o hello # For C programsg++ -g hello.cpp -o hello # For C++ programs |
Otherwise, GDB can only see assembly and memory addresses, and cannot perform source-level debugging.
Startup methods
Debug a program
1 | gdb ./program |
Set program runtime parameters
Set runtime parameters (e.g., command-line arguments):
1set args 10 20 30View the currently set parameters:
1show args
Set runtime environment variables
Set the program run path (used to find the executable):
1path /your/bin/dirView run path settings:
1show pathsSet environment variables(e.g., passed to
main()the program’s environment):1set environment USER=yournameView environment variables:
12
show environmentshow environment USER
Set working directory
Setting the working directory refers to the current directory when the program is running.
Change current directory(equivalent to the shell’s
cd):1cd /path/to/dirView current directory:
1pwd
Control the program’s input and output
View the terminal information bound to the program:
1info terminalRedirect output (e.g., save output to a file):
1run > output.txtSpecify the terminal device used for program input and output:
1tty /dev/pts/1
Debug core dump files
Linux core dump:
Commonly known as core dump or kernel dump, we collectively refer to them as dump files. It is a memory information mapping of a process at a certain moment, that is, it contains the entire memory information and registers of the process at the time the dump file was generated. A dump file can be for a single process or for the entire system. It can be generated while the process is alive, or automatically generated when the process or system crashes.
Creating a core dump file for a live process can generally be done with gdb. After attaching the process using gdb, execute the generate-core-file or gcore command to generate the core dump file.
More often, we analyze core dump files generated by crashes.
Generate a coredump file for a live process
Generating a core dump file via gcore does not affect the program’s operation at all.
123 | gdb attach pid(gdb) gcore test.core(gdb) detach |
A core dump is a dump after a program crashes.
1 | gdb ./program core |
Enable Linux core file generation
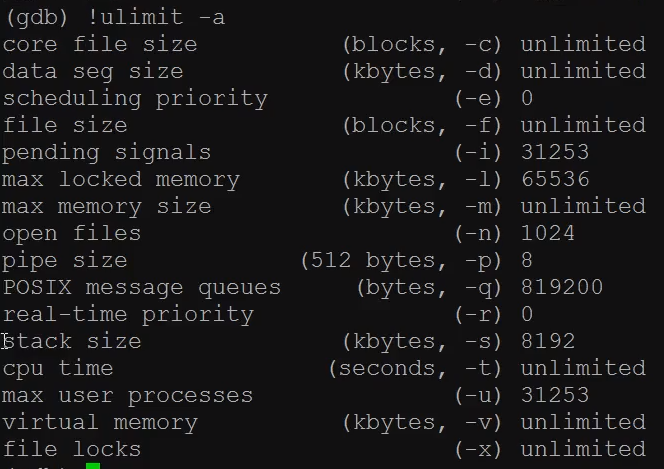
Linux By default, core file generation is not enabled., that is, when a segmentation fault occurs, it will notcore dumped. You can enable it with the following commandcorefile generation:
12 | # Do not limit the size of the generated coreulimit -c unlimited |
unlimitedmeaning the systemdoes not limit the size of the core file, as long as there is enough disk space, it will dump all the memory occupied by the program; if you need to limit the system from generatingcore the size, you can use the following command:
12 | # The maximum core size limit is 409600 bytesulimit -c 409600 |
You can configure the name of the generated coredump file so that it does not overwrite the default coredump file.
1 | echo -e "%e-%p-%t" > /proc/sys/kernel/core_pattern |
Disable Linux core file generation.
To disable core dumps, simply set the limit size to0That’s it:
1 | ulimit -c 0 |
Note: if you just enter the command “ulimit -c unlimited”, it will only be effective in the current terminal; it will be invalid when you exit the terminal or open a new one.
Example:
Write a simple C program to deliberately create aSegmentation faulterror:
123456789101112 | int main(int argc, char **argv){ int *p = NULL; // Assigning a value to a NULL pointer will cause a Segmentation fault error. *p = 100; return 0;} |
In the above code, a null pointer variable is definedp, then give the null pointerpa value, and running the program willproduce a segmentation fault.。
After enablingcore dump, a … will be generated. corefile.
12345 | # Compile hello.c to generate the hello program.gcc -o hello hello.c -g# Run the program../hello |
After running, we can seeSegmentation fault (core dumped)a message indicating that a … has been generated in the current directory.core file:
Debug a running program.
1 | gdb ./program <PID> |
- Start GDB by directly specifying the PID(requires the path to the executable):
1 | gdb ./program <PID> |
- Attach to a PID within GDB:
12 | (gdb) attach <PID>(gdb) detach # Detach |
Common startup parameters
| Parameters | meaning |
|---|---|
-sor-symbols <file> | Specify symbol table file |
-se <file> | Specify symbol table file and associate it with the executable |
-cor-core <file> | Specify core dump file for debugging |
-dor-directory <dir> | Add source search path (default use$PATH) |
To exit, just enter quit(q)
Running Shell commands in gdb
In GDB, you can directly run operating system commands as follows:
12 | (gdb) shell <命令字符串>(gdb) !<命令字符串> |
example
12 | (gdb) shell ls -l(gdb) shell cat input.txt |
This will start your system’s shell inside GDB (determined by the environment variableSHELLdetermined), and then execute the command you wrote.
GDB also has a built-in command:
1 | (gdb) make <参数> |
It is essentially equivalent to:
1 | (gdb) shell make <参数> |
That is, it will call the system’smaketool to recompile the program, which is very convenient for quickly rebuilding after modifying code during debugging.
12 | (gdb) pipe i locals | grep test(gdb) | thread apply all bt | wc |
Saving gdb debug output log
12345678 | # Enable log output(gdb) set logging on# Disable log output(gdb) set logging off# Set output file(gdb) set logging file filename# Overwrite output file, default is append(gdb) set logging overwrite |
Debugging the program
Source code
Display source code
- Display source code list or **l,**Displays 10 lines by default
- Set the number of lines to display each time:set listsize xx
- View the code of the specified function:list test_fun
- View the code at a specified line in a specified file: list main.cpp:15
Search source code
- search Regular expression
- forward-search Regular expression
- reverse-search Regular expression
(After entering the search command, pressing Enter will continue to find the next match; use the list command to specify the starting search position)
Set source code search directory
- directory path
Breakpoint
Set breakpoint
Set breakpoint by function name
1 | break function |
- At the specified function’sentrystop.
- For C++, it can be written as:
break ClassName::Functionbreak function(type1, type2)(if overloaded)
Set breakpoint by line number
1 | break 42 |
- In the current source file, at line 42 set a breakpoint.
Set breakpoint relative to current line
12 | break +5 // 5 lines after the current linebreak -3 // 3 lines before the current line |
Specified file + line number
1 | break filename.c:42 |
- Before
filename.cset breakpoint at line 42.
Specify file + function name
1 | break filename.c:func |
- Before
filename.cinfuncSet a breakpoint at the function entry.
Set breakpoint by address
Commonly used in assembly debugging
1 | break *0x4007d0 |
- At the program memory address
0x4007d0Set a breakpoint at the location.
Set conditional breakpoint
1 | break func if i == 100 |
- When a variable
i == 100and execution reachesfuncfunction, only then stop.
Set breakpoint at the next statement (no arguments)
1 | break |
- Set a breakpoint at the statement that will be executed next.
View breakpoints
View all breakpoints
1 | info breakpoints |
View breakpoint with specified number
1 | info break 3 |
Delete breakpoint
Delete a specific breakpoint
12 | delete <编号>del <编号> |
- For example:
delete 1Delete the breakpoint numbered 1.
Delete multiple breakpoints
1 | delete 1 2 3 |
- Delete breakpoints 1, 2, and 3 simultaneously.
Delete all breakpoints
1 | delete |
- Without parametersIndicates deleting all breakpoints. GDB will prompt you to confirm (enter
y)。
Add commands to breakpoint
123 | commands <bnum>...gdb命令序列...end |
Example:
12345 | break foo if x > 0commandsprintf "x is %d\n", xcontinueend |
Effect: When x > 0, the breakpoint hits, prints, and automatically continues, no need to manually press
c。
123456 | b 31commands>p *curr>p prev>endi b |
After setting commands for a breakpoint, when the program stops at that breakpoint, automatically print these two values;
The commands command can be directly followed by the breakpoint number
12 | i bcommands 2 |
Clear existing commands
12 | commands <bnum>end |
Ignore breakpoint count (ignore)
1 | ignore <bnum> <count> # Ignore breakpoint number bnum for count triggers |
For example:
1 | ignore 2 3 |
Ignore the first three hits of breakpoint 2, and only break on the 4th hit.
example
When debugging problems in loops or large functions, it is recommended to use:
break <line> if i == 9999
orignore <bnum> 9998After you locate the bug, don’t delete the breakpoint, just:
1disable <bnum> # Keep the breakpoint for later reuseWhen you want to test changes of multiple variables:
12
watch awatch b
If you want to do automated debugging:
1234
silentprintf "Reached here\n"continueend
Save breakpoints to a file and read them
12 | (gdb) save breakpoints d.txt(gdb) !cat d.txt |
After closing and reopening, apply the saved breakpoint information
1 | (gdb) source d.txt |
Watchpoint
A watchpoint is a special breakpoint that stops execution when the value of an expression changes. The expression can be a variable’s value, or it can contain the values of one or more variables combined by operators, e.g., ‘a+b’. Sometimes called a data breakpoint.
Set watchpoint
watch <expr>
Purpose: when an expression or variable
exprof value is changed the program pauses.example:
12
watch xwatch gdata+gdata2>10
When a variable
xpauses when its value changes.If any thread satisfies gdata+gdata2>10, the program will stop.
rwatch <expr>
Purpose: when an expression or variable
exprareRead, the program pauses.example:
1rwatch yWhen a variable
yPause the program when read.
awatch <expr>
Purpose: when an expression or variable
exprareis read or written, the program pauses.example:
1awatch zWhen a variable
zpauses both when read and when written.
View current watchpoints
1 | info watchpoints |
- Display all set watchpoints (similar to
info breakpoints)。
Delete watchpoints
1 | delete <编号> |
- Same as deleting breakpoints.
Notes.
- Watchpoints depend on whether the target architecture supports hardware watchpoints(most support them).
- If not supported, GDB may not be able to set
watch、rwatchetc. - The number of watchpoints is limited, generally fewer than breakpoints (usually 4).
Catch point (catchpoint)
A catchpoint is a special breakpoint. The command syntax is: catch event, that is, when the event is caught, the program stops.
Command format
1 | catch <event> |
You can also use a one-time catchpoint:
1 | tcatch <event> |
Common catchpoint types
| Event type | Description |
|---|---|
throw | Catches the location where a C++ program throws an exception. |
catch | Catches the location where a C++ program catches an exception. |
exec | Catch program callsexec()system calls (replacing the process image). |
fork | Catch program callsfork()System call (create child process). |
vfork | Catchvfork()call (special type offork())。 |
load | Catch dynamic link library load events. |
unload | Catch dynamic link library unload events. |
example
1 | catch throw |
Break program when C++ throws an exception.
1 | catch fork |
When program calls
fork()break.
1 | tcatch exec |
Set a one-time catchpoint, when program calls
exec()pause on system call, then automatically remove.
| command | Description |
|---|---|
| catch assert | Catch failed Ada assertions, when raised. |
| catch catch | Catch an exception, when caught. |
| catch exception | Catch Ada exceptions, when raised. |
| catch exec | Catch calls to exec. |
| catch fork | Catch calls to fork. |
| catch handlers | Catch Ada exceptions, when handled. |
| catch load | Catch loads of shared libraries. |
| catch rethrow | Catch an exception, when rethrown. |
| catch signal | Catch signals by their names and/or numbers. |
| catch syscall | Catch system calls by their names, groups and/or numbers. |
| catch throw | Catch an exception, when thrown. |
| catch unload | Catch unloads of shared libraries. |
| catch vfork | Catch calls to vfork. |
Program stop point clear
Clear stop points (clear)
12345 | clear # Clear all stop points at current locationclear <function> # Clear all stop points on functionclear <filename:function># Specify source file and functionclear <linenum> # Clear breakpoint at a line in current fileclear <filename:linenum> # Clear by specifying file + line number |
Description:
clearis based on ‘Position’ clear, not by number.
Delete breakpoints (delete)
1234 | delete # Delete all breakpointsdelete <bnum> # Delete breakpoint with specified numberdelete <range> # e.g., delete 3-5, delete breakpoints numbered 3 to 5d # abbreviation for delete |
Disable/Enable breakpoints
12345678 | disable # Disable all breakpointsdisable <bnum> [range] # Disable specific breakpointsdis # Short for disableenable # Enable all breakpointsenable <bnum> # Enable a specific breakpointenable <bnum> once # Automatically disable after one executionenable <bnum> delete # Automatically delete after one execution |
recommended to use
disable/enableManage debugging state flexibly without losing breakpoint information.
Set/Modify breakpoint condition
Set conditional breakpoint (when setting)
12 | break foo if x > 5watch var if var == 0 |
Modify breakpoint condition (when maintaining)
12 | condition <bnum> x > 100 # Modify the condition of breakpoint number bnumcondition <bnum> # Clear breakpoint condition |
Debug program execution
Resume program execution (continue)
| command | Description |
|---|---|
continue/c/fg | Continue running from the current breakpoint |
continue <ignore-count> | Ignore the next<count>breakpoint hits |
run/r | Restart the program (from the beginning) |
Applicable when the program has just stopped and you want to skip some breakpoints or continue execution.
Single-step debugging (source code level)
| command | Description |
|---|---|
step/s | Single-step execution, enters function (Step Into) |
next/n | Single-step execution, does not enter function (Step Over) |
step <count>/next <count> | Continuous execution<count>steps |
Used to view program logic line by line,
stepwill step into the function,nextor skip over it.
Exit the current function (function-level jump out)
| command | Description |
|---|---|
finish | Continue running until the current function returns, and print the return value and return address |
Very useful, suitable for exiting a function after tracing it.
Jump out of loop body / block (until)
| command | Description |
|---|---|
until <location>/u | Execute until a certain location or the end of the current block (suitable for exiting loops) |
Example:
12 | until 42 # Run to line 42 of the current fileuntil main.c:100 # Run to line 100 of main.c |
Used to quickly jump out of structural blocks such as for/while loops.
Assembly-level single-step (instruction-level debugging)
| command | Description |
|---|---|
stepi/si | Single-step execute one machine instruction (Step Into) |
nexti/ni | Single-step execute one machine instruction (Step Over) |
Used for low-level tracing, such as tracing system calls, libc internal logic, or boot code.
Assembly viewing suggestions:
1 | display/i $pc # Display the currently executing instruction in real time |
Set step-mode mode
Mainly used to control whether to enter functions without symbols
| command | Description |
|---|---|
set step-mode on | Stop even without debug symbols (default off) |
set step-mode off | Skip functions without symbols when encountered (default) |
Useful when debugging assembly or library files that contain only partial symbols.
skip skips single-stepping into a certain function
- skip function
1 | test_str(test.get_str()); |
If we don’t care about get_str() but want to see test_str(), when executing the s command, it will first enter get_str()
12345 | (gdb) s(gdb) finish(gdb) skip test_c::get_str(gdb) s |
skip is not jump. Although the function is skipped, it still executes; it just skips debugging.
- skip file filename
1 | (gdb) skip file test.cpp |
- skip -gfi wildcard
12 | -gfi可以通过文件名通配符匹配的方式跳过(gdb) skip -gfi common/*.* |
jump command to jump
Resume execution at the specified location. If a breakpoint exists, it will stop when it reaches the specified location. If there is no breakpoint, it will not stop. Therefore, we usually set a breakpoint at the specified location.
jumpThe command only changes the value of the program counter,**and does not restore or modify the state of the current stack frame, stack pointer, or other registers,**so after jumping to a new location, if the function requires a correct stack environment, it may cause undefined behavior.
1234567 | # You can jump forward or backward to skip certain lines, but the result of jumping to another function is unpredictable.(gdb) jump location(gdb) j location# You can implement the jump by changing the pc register.(gdb) i line 12(gdb) p $pc=0x5400000 |
- Core function: force the programto jump to the specified location and execute(can be any line number or address), directly ‘skipping’ the intermediate execution steps.
rn reverse execution
First, execute the record command.
It is available by default in all-stop mode (no need to switch to non-stop mode).
12345678 | (gdb) record........# Execute one step in reverse.(gdb) rn# Execute in reverse to the beginning of this function.(gdb) reverse-finish(gdb) record stop |
Core function: implementthe backtracking of program execution history, allowing the program to ‘run backwards’ to investigate errors that have already occurred (such as when a variable was unexpectedly modified).
Stop mode (default)
When you execute
runorcontinue,the entire program and all threads will pause/continue.。Features:
- Simple and easy to use
- Cannot control threads individually during thread debugging
The default is stop mode.
Non-stop mode
Each thread can be paused or resumed individually without affecting other threads.
Features:
- You can pause only one thread for debugging in a multi-threaded program
- Supports more flexible thread debugging
How to enable:
1set non-stop onNote:
- Some features are not supported, such as process record(execution recording) and some remote target features
View runtime data
When the program is paused, use the print command (abbreviated p) or the synonym command inspect to view the current program’s runtime data, in the format:
12 | print <expr>print/<f> <expr> |
is an expression in the language of the program being debugged means format, for example, output in hexadecimal is /x
print(p) output format
Generally, GDB outputs the value of a variable based on its type. But you can also customize GDB’s output format. For example, if you want to output an integer in hexadecimal or binary to view this integer
variable’s bits. To do this, you can use GDB’s data display formats:
- x Display the variable in hexadecimal format. (hex)
- d Display the variable in decimal format. (decimal)
- u Display unsigned integer in hexadecimal format. (unsigned hex)
- o Display the variable in octal format. (octal)
- t Display the variable in binary format. (two)
- a Display the variable in hexadecimal format. (address)
- c Display the variable in character format. (char)
- f Display the variable in floating-point format. (float)
1234567891011 | (gdb) p i$21 = 101(gdb) p/a i$22 = 0x65(gdb) p/c i$23 = 101 'e'(gdb) p/f i$24 = 1.41531145e-43 (gdb) p/x i$25 = 0x65(gdb) p/t i$26 = 1100101 |
expression
Expressions can be const constants, variables, functions, etc. in the current program execution, but cannot be macros defined in the program.
Program variables
In GDB, you can view the values of the following three types of variables at any time:
- Global variables (visible to all files)
- Static global variables (visible to the current file)
- Local variables (visible in the current scope)
The value of a variable displayed with print will be the value of the local variable in the function. If you want to view the value of a global variable at this time, you can use the “::” operator:
12 | file::variablefunction::variable |
example
1 | gdb) p 'f2.c'::x |
Note: If your program is compiled with optimization options enabled, then when debugging the optimized program with GDB, some variables may become inaccessible, or incorrect values may be obtained. This is normal, because the optimizer will modify your program, rearrange the order of statements, and remove meaningless variables, etc. Therefore, when debugging such a program with GDB, the runtime instructions will differ from the instructions you wrote, leading to unexpected results. To deal with this situation, you need to disable compilation optimization when compiling the program. Generally speaking, almost all compilers support a compilation optimization switch. For example, for GNU’s C/C++ compiler GCC, you can use the “-gstabs” option to solve this problem.
Array
1 | int *array = (int *) malloc (len * sizeof (int)); |
During GDB debugging, you can use the following command to display the values of this dynamic array:
1 | p *array@len |
The left side of @ is the value of the first address of the array, that is, the content pointed to by the variable array; the right side is the length of the data, which is stored in the variable len. The output result is roughly like the following:
12 | (gdb) p *array@len$1 = {2, 4, 6, 8, 10, 12, 14, 16, 18, 20, 22, 24, 26, 28, 30, 32, 34, 36, 38, 40} 如果是静态数组的话,可以直接用 print 数组名,就可以显示数组中所有数据的内容了。 |
If it is a static array, you can directly use print with the array name to display the contents of all data in the array.
examine(x) view memory
Use the examine command (abbreviated as x) to view the value at a memory address. The syntax of the x command is as follows:
1 | x/<n/f/u> <addr> |
n: the number of units to display, i.e., from the memory address
start, display several units (default is 1). f: display format, for example:
- x hexadecimal
- d decimal
- t binary
- c character
- f floating point
- s string
- i instruction
u: the size of the read unit, determining how many bytes to read each time:
- b = 1 byte
- h = 2 bytes (half word)
- w = 4 bytes (word, default)
- g = 8 bytes (giant/quad word)
Viewing registers
To view the values of registers, it’s simple: you can use info registers (i r)
1234 | # View the status of registers (excluding floating-point registers).info all-registers# View the status of all registers (including floating-point registers).info registers <regname ...> |
You can also use the print command to access registers, just add a$symbol and that’s it. For example:
1 | p $eip。 |
View the status of the specified register.
Registers hold data at runtime, such as the current instruction address (ip) and the current stack address (sp). You can also use the print command to access registers, just add a$symbol and that’s it. For example: p $eip.
Automatic Display
You can set some variables to be automatically displayed. When the program stops, or when you are single-stepping, these variables will be displayed automatically. The relevant GDB command is display.
123 | display <expr>display/<fmt> <expr>display/<fmt> <addr> |
- expr is an expression
- fmt indicates the display format
- addr indicates a memory address
After you set one or more expressions with display, whenever your program stops, GDB will automatically display the values of these expressions.
Formats i and s are also supported by display. A very useful command is:
1 | display/i $pc |
$pc is a GDB environment variable that represents the instruction address, and /i indicates the output format as machine instruction code, i.e., assembly. Thus, when the program stops, you will see the source code and machine instruction code corresponding to each other.
Deleting Automatic Display
To delete automatic displays, use the following command:
12 | undisplay <dnums...>delete display <dnums...> |
- dnums refers to the numbers of the set automatic displays.
If you want to delete several at once, separate the numbers with spaces. To delete a range of numbers, use a hyphen (e.g., 2-5).
Hiding Automatic Display
12 | (gdb) disable display <dnums...>(gdb) enable display <dnums...> |
disable and enable do not delete the auto-display settings, but only invalidate and restore them.
View the set auto-display information.
1 | (gdb) info display |
View the auto-display information set by display. GDB prints a table reporting how many auto-display settings have been set in the current debugging session, including the setting number, expression, and whether it is enabled.
View function parameters.
12345 | (gdb) info args(gdb) i args# View what functions are available.(gdb) info functions |
View local variables.
12 | (gdb) info locals(gdb) i locals |
Modify values during execution.
Modify the value of a variable.
12 | (gdb) p test.age=28(gdb) set {int}&test.gender = 110 |
Modify the value of a register.
12 | set var $pc=xxxp $rip=xxx |
Can be used with the info command to view the address of a certain line, or the address of a certain stack frame.
1234 | info line 14p $pc=0x5555555553a3info f 0 |
View the function call stack.
backtrace/bt View stack backtrace information.
frame n Switch stack frames.
info f n View stack frame information.
View data type information.
whatis
12345 | (gdb) whatis test1(gdb) whatis test2(gdb) whatis node(gdb) whatis main(gdb) whatis test3.test_fun2 |
ptype
1 | (gdb) ptype test1 |
Can display member variables, functions, etc. of this class.
ptype /m
1 | (gdb) ptype /m test1 |
Stop displaying member functions.
ptype /t
1 | (gdb) ptype /t test3 |
Do not display typedefs.
ptype /o
1 | (gdb) ptype /o node |
View the offset and size of a structure.
i variables
1 | (gdb) i variables count |
Will display the definitions of all variables whose names contain ‘count’.
set print object on
12 | (gdb) set print object on(gdb) ptype test2 |
set print object on means to display the derived type of the class.
Call internal and external functions.
- p expression
Evaluate the expression and display the resulting value. The expression can include calls to functions in the program being debugged; even if the function return value is void, it will be displayed.
- call expression
Evaluate the expression and display the result value. If it is a function call and the return value is void, do not display the void return value.
1234567 | p sizeof(int)p strlen(name)call (int)getpid()call malloc(10)call strcpy($5,"soft") |
Also strcmp, printf, etc.
Debugging multithreaded programs
Commands related to thread management
info threads
12 | (gdb) info threads(gdb) i threads |
View all thread information. In the results, an asterisk (*) before the sequence number indicates the current thread.

- Thread is followed by the thread address.
- LWP stands for Light Weight Process, a lightweight thread (you can use
ps -aLin the command line to view all lightweight threads). - When naming a thread, the process name is used by default.
thread find
Search for threads
12 | (gdb) thread find multh(gdb) thread find 689519 |
The search scope is thread, address, lwp, and thread name, i.e., the first three items ofi threads.
thread num
123 | (gdb) bt(gdb) thread 2(gdb) bt |
Switch thread;btonly shows the call stack of the current thread.
thread name
Set thread name; it sets the name of the current thread.
1 | (gdb) thread name main |
b breakpoint thread id
Set a breakpoint for a specific thread.
1 | (gdb) b 15 thread 2 |
If you use a normalb 15, then all threadsthat can execute to line 15will all stop.
thread apply
Execute a command for a thread.
1234 | (gdb) thread apply 3 i args(gdb) thread apply 1 2 3 i args(gdb) thread apply 1-3 5 i args(gdb) thread apply all i locals |
-qdoes not display thread information.
-sdoes not display error information.
Both parameters must be placed after the thread id.
set scheduler-locking off|on|step
set scheduler-lockingBy setting a locking policy, restrict the execution of other threads to ensure the debugging focus is always on the target thread.
| Parameters | Function | Applicable scenarios |
|---|---|---|
off | Disable locking (default); the scheduler can freely switch among all threads for execution. | When you need to observe multithreaded interactions (such as thread synchronization, communication), allow other threads to execute naturally. |
on | Enable full locking,Only the currently debugged thread can execute., other threads are paused. | Focus on debugging the logic of a single thread (such as function call chains, local variable changes), avoiding interference from other threads. |
step | Step locking, only when single-stepping (step) lock other threads,continueunlock when. | When single-step debugging, other threads need to be isolated, but we hope thatcontinueafterwards the program can run normally in multithreaded mode. |
123456789101112 | # View current scheduler-locking configuration(gdb) show scheduler-lockingscheduler-locking is off.# Set to full locking (on) to ensure the currently debugged thread exclusively occupies the core(gdb) set scheduler-locking on# When single-stepping kernel code, set to step locking (step)(gdb) set scheduler-locking step# After debugging is complete, restore to default (off)(gdb) set scheduler-locking off |
Print thread event information
12 | (gdb) show print thread-events(gdb) set print thread-events off |
Multithreaded deadlock debugging
Deadlock conditions:
- Mutual exclusion condition
- Hold and request condition
- No preemption condition
- Circular wait condition
Common commands:
- thread 2
- bt
- f 2
- p _mutex_2

Ways to resolve deadlock:
- Use locks in order
- Control the scope of locks
- You can use a timeout mechanism
Multiprocess program debugging
Basic Concepts
inferior
gdb uses inferior to represent the state of a process being debugged. Usually, one inferior represents one process. This is an internal concept and object of gdb. We can attach a running process to an inferior.
12345678910 | (gdb) i inferiors(gdb) add-inferior(gdb) remove-inferior 1(gdb) !ps aux | grep rele(gdb) attach 2959251(gdb) i inferiors(gdb) detach inferior 2 |
set schedule-multiple on/off
Allow multiple processes to execute simultaneously
12 | (gdb) show schedule-multiple(gdb) set schedule-multiple on |
Debug child processes
By default, child processes cannot be debugged
set follow-fork-mode child/parent
By default, follow-fork-mode is set to parent, meaning debugging follows the parent process. Only when set to child does it follow the child process.
12 | (gdb) set follow-fork-mode child(gdb) show follow-fork-mode |
set detach-on-fork on/off
By default, detach-on-fork is on, meaning when debugging a child process, the parent process continues to execute. The parent process may finish execution directly, making it impossible to debug the parent. Therefore, if you want to debug both parent and child processes simultaneously, you need to
1 | (gdb) set detach-on-fork off |
info inferiors
View processes started by gdb, i.e., gdb’s child processes
inferior process_num
Switch to child process 1
1 | (gdb) inferior 1 |
Creating a debug release
The release needs a version without debug information, and also keep a version with debug information for convenient debugging.
Method 1: Two versions, one without the -g parameter and one with the -g parameter.
Write two compilation tasks in the Makefile, one with the -g parameter and one without the -g parameter.
Method 2: strip command
Keep the version with debug information, and only strip debug symbols from the release version:
12345 | # Only strip debug symbols from the release version, keep the debug version intact.strip -g release_version.o# When debugging, use the debug version to provide symbols, and the release version as the executable.gdb --symbol=debug_version.o -exec=release_version.o |
Method 3: objcopy command
1234 | # Generate a pure debug symbol fileobjcopy --only-keep-debug debug_version.o debug.sym# Debugginggdb --symbol=debug.sym -exec=release_version.o |
Directly edit the executable file
Add the --write parameter when starting gdb
123 | gdb --write ./test# Display the assembly and machine code corresponding to the source code(gdb) disassemble /mr check_some |

What we need to modify is the machine code; exit directly after modification.
12 | (gdb) set {unsigned char}0x00000000000011b4=0x65(gdb) q |
Memory checking
Memory leak checking
call malloc_stats()
1 | (gdb) call malloc_stats() |
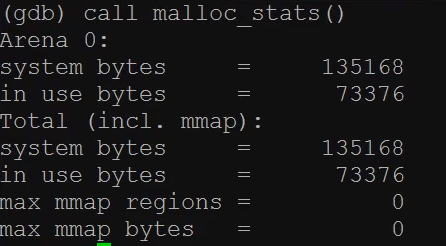
Arena0 indicates the memory data used by the current thread.
Total indicates the memory data used by the entire process.
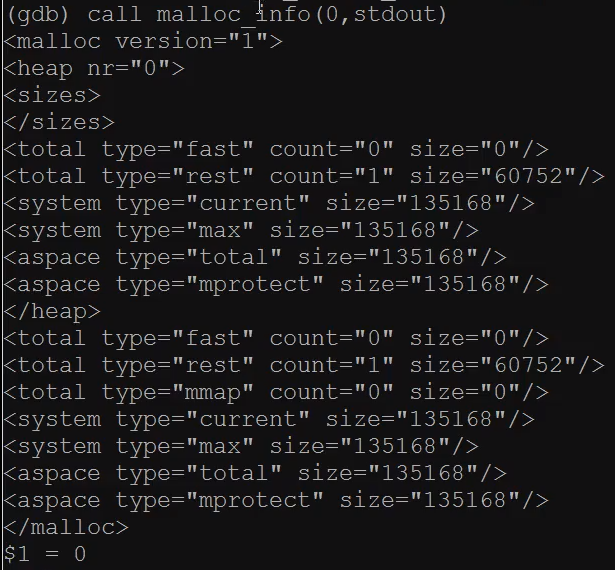
call malloc_info(0, stdout)
1 | (gdb) call malloc_info(0, stdout) |
The output is in XML format; focus mainly on rest field (remaining available memory)
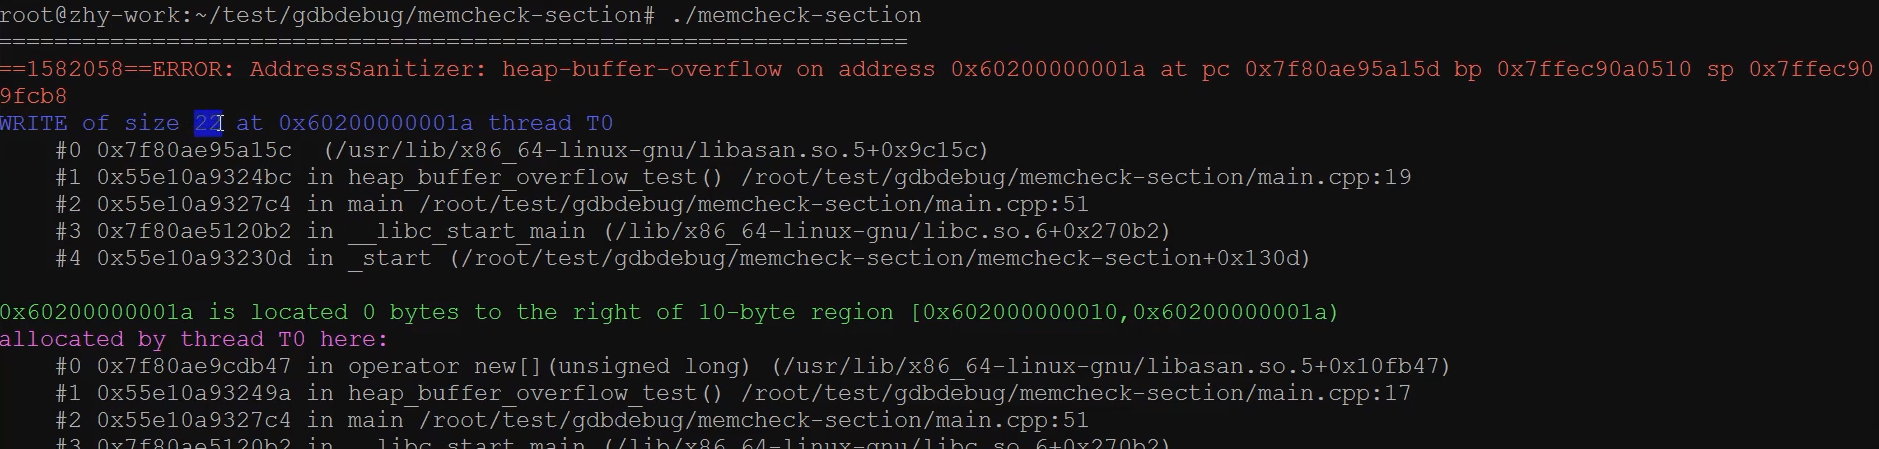
gcc option -fsanitize=address
- Check for memory leaks

- Check for heap overflow

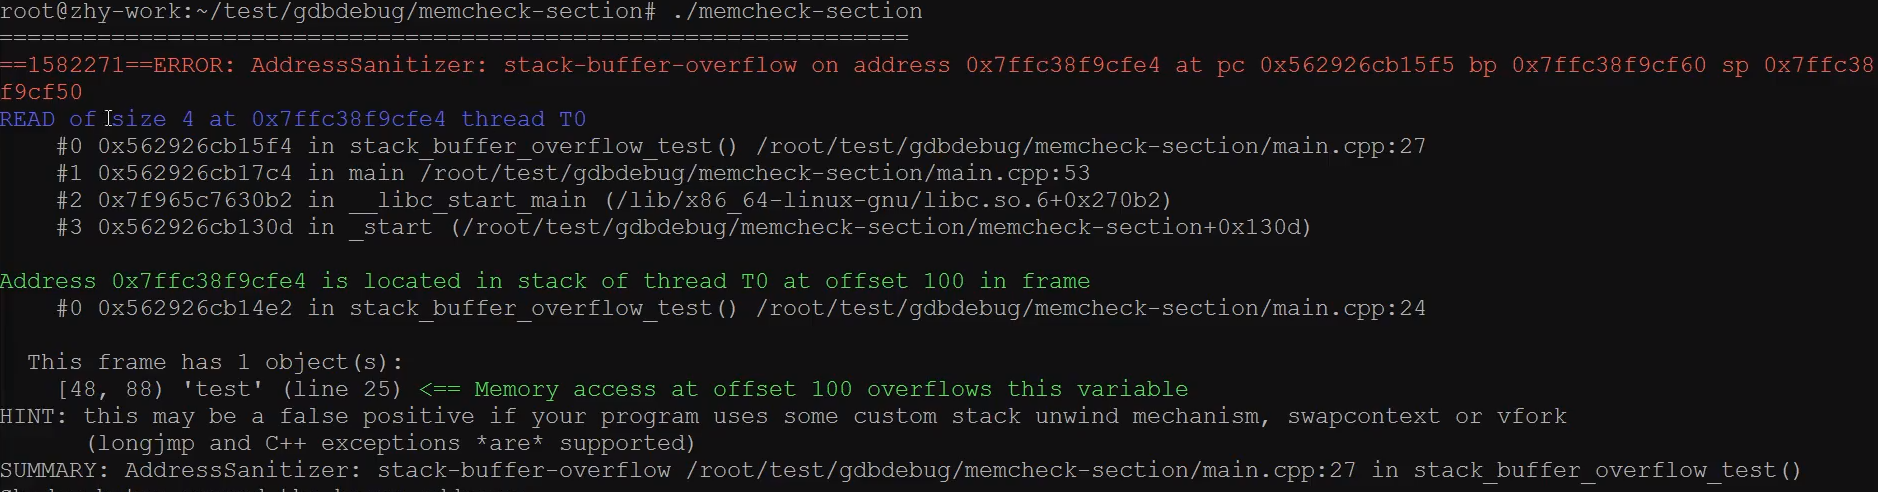
- Check for stack overflow
- Check for global memory overflow

- Check for use-after-free

Remote debugging
- Server side / machine being debugged
Install gdbserver, start gdbserver
123456789 | ifconfigsudo apt-get install gdbserver# This port can be chosen arbitrarily, but it must not conflict with other programs and must not be blocked by the firewall.gdbserver 10.20.50.83:9988 ./test.o# If the program has already started, first get the program PID via the ps command, thengdbserver 10.20.50.83:9988 --attach pid |
- Client / debugger machine
gdb connects remotely and debugs
12345 | (gdb) target remote 10.20.50.83:9988# Entering quit in the remote program will not cause the remote program to end.(gdb) quit# You can also use detach(gdb) detach |